






Live Online Training
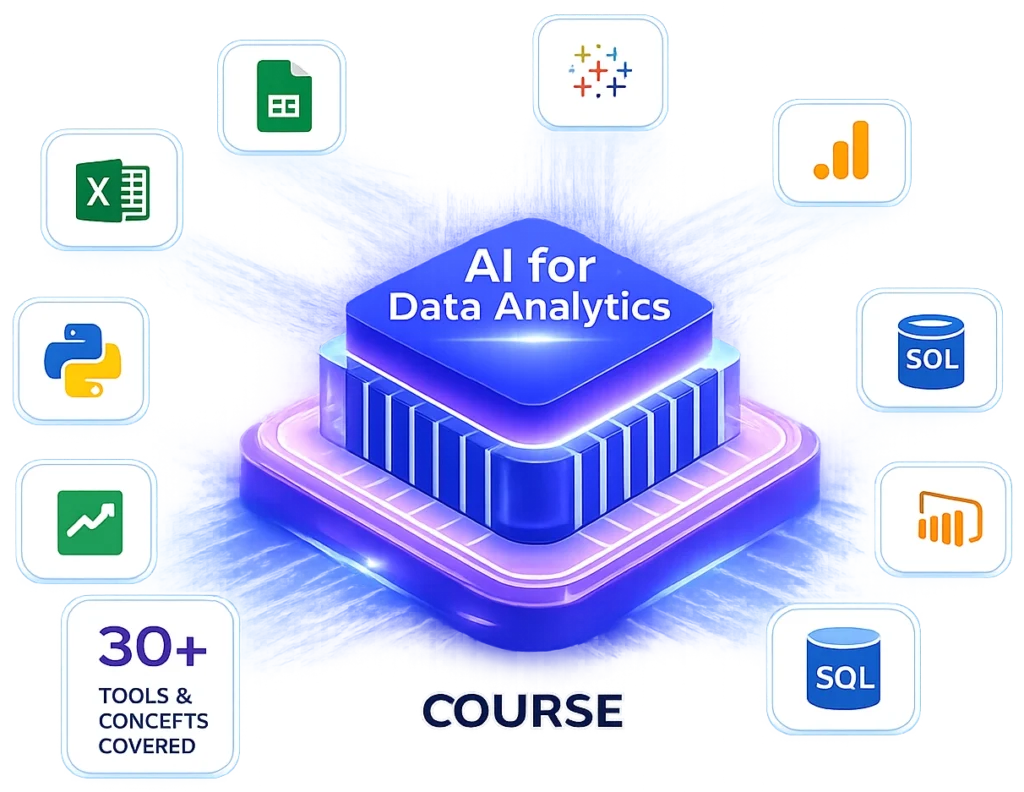
AI for Data Analytics Course
The modern analyst toolkit in one program. Twelve weeks of live instruction covering Python, SQL, AI-powered analysis, Power BI, Tableau, and predictive modeling basics. Built for analysts and BI professionals modernizing their skills without committing to a full data science track.
Live Online Training
Power BI + Tableau
AI-Augmented Analysis
Analyst-Paced Format
Trusted by Learners & Professionals from Top Companies
WHY LEARN AI-AUGMENTED ANALYTICS TODAY?
The Modern Analyst Toolkit — In One Program
- Analyst roles have bifurcated — modern-toolkit analysts pull ahead of Excel-only ones
- Learn Python, SQL, AI-powered analysis, Power BI, and Tableau in a single track
- Analyst-paced format — two sessions per week, sustainable alongside full-time work
- No prior coding required — the course teaches Python and SQL from scratch
- Bridge to data science available for those who want to go deeper afterward
WHAT YOU'LL LEARN
Python for Analytics
SQL for Analysts
Pandas Deep Dive
AI-Assisted Analysis
Data Visualization
Predictive Modeling Basics
Power BI Mastery
Tableau Mastery
TOOLS & PLATFORMS YOU'LL MASTER
Python
The modern analyst's must-have language
SQL
The universal language of data

Pandas
Analytical workflows at scale

NumPy
Numerical foundation for analytics

Matplotlib
Foundational visualization

Seaborn
Statistical visualization

Plotly
Interactive analytical visualizations

Power BI
Microsoft's leading BI platform

Tableau
Industry-standard visualization platform

ChatGPT
AI-assisted analytical workflows

Claude
AI for analytical writing and reporting

Jupyter
Analyst-friendly development environment

COURSE CURRICULUM
01
02
03
04
05
Week 1
Python for Analysts
- Python fundamentals for analytical work
- Pandas essentials
- Excel-to-Pandas translation
- Reading business data
- Analytical notebook conventions
Week 3
SQL Deep Dive
- SELECT, WHERE, GROUP BY
- JOINs (inner, left, right, full)
- Subqueries and CTEs
- Window functions
- Analytical SQL patterns
Week 5
AI-Powered Analysis
- Natural language to SQL
- AI-assisted EDA
- AI-augmented data cleaning
- AI for analytical writing
- Reliable AI workflows
Week 8
Predictive Modeling Basics
- The predictive modeling workflow
- Linear and logistic regression
- Decision trees and random forests
- Evaluating predictive models
- Time series basics
Week 11
Power BI & Tableau
- Power BI data modeling and DAX
- Tableau calculated fields and LODs
- Integrating Python with BI
- AI features in modern BI
- Dashboard design principles
What You Will Learn
The Twelve-Week Curriculum
The curriculum is organized into four arcs across twelve weeks. The pace is calibrated for working analysts — two sessions per week with practical homework — rather than the more intensive technical bootcamp pace.
The first arc establishes the two foundational technical skills that modern analyst roles increasingly require: Python and SQL. Topics include Python fundamentals for analysts, Pandas for analytical work, SQL fundamentals (SELECT, WHERE, GROUP BY, JOINs, subqueries, CTEs, window functions), working with multiple data sources, Excel-to-Python translation (a major productivity accelerator), and Jupyter notebooks for analytical work.
By the end of Arc 1, learners can replace most of their existing Excel-based analytical work with Python and SQL, and have done so on real business datasets in class.
You will Explore
Python for Analysts
Pandas Deep Dive
SQL & Window Functions
Excel-to-Python Translation
The second arc covers the AI tools and AI-augmented analysis patterns that distinguish modern analyst work. Topics include using ChatGPT and Claude in analytical workflows; natural language to SQL and to Python; AI-assisted EDA and data cleaning; AI for analytical writing and reporting (with discipline about verification); visualization fundamentals; and visualization in Python with Matplotlib, Seaborn, and Plotly.
The framing is practical rather than promotional — the course covers what AI genuinely adds to analytical work and where it fails.
You will Explore
AI-Assisted SQL & Python
Kubernetes Fundamentals
Visualization Principles
Python Visualization Stack
The third arc introduces the predictive modeling basics that increasingly distinguish senior analyst roles from junior ones. Depth is calibrated for analysts — enough to apply methods to real business problems with appropriate judgment, not enough to qualify as a data scientist.
Topics include the predictive modeling workflow; linear regression for analysts; logistic regression and classification; decision trees and random forests; evaluating predictive models; time series basics for revenue and demand forecasting; and honest limits — what predictive modeling can and cannot do.
You will Explore
Predictive Modeling Workflow
Regression for Analysts
Trees & Random Forests
Time Series Forecasting
The fourth arc covers the business intelligence platforms most US analyst roles work with, with explicit attention to integrating Python and AI-powered analysis into BI workflows.
Topics include Power BI in depth (data modeling, DAX measures, time intelligence); Tableau in depth (calculated fields, LODs, parameter actions); integrating Python with Power BI and Tableau; AI features built into modern BI platforms; dashboard design principles; and storytelling with data. Capstone project ends the arc.
Power BI & DAX
Tableau Deep Dive
Python + BI Integration
Dashboard Design Craft
Capstone Project
Analyze • Model • Present
A complete analytical project from problem framing through analysis, predictive modeling where appropriate, BI dashboard delivery, and a written executive summary. Learners select their capstone topic from their own professional context.
By the end of twelve weeks, you'll be the analyst on your team who works with the full modern toolkit — Python, SQL, AI, and BI.
REAL-WORLD PROJECTS
Excel-to-Pandas Migration
Take a real Excel workflow and rebuild it in Python.

SQL Analytical Deep Dive
Complex analytical query project on realistic business data.
AI-Assisted EDA
Exploratory analysis using ChatGPT and Claude as a copilot.
Predictive Model
Churn or demand forecasting on business-realistic data.

BI Dashboard Capstone
Complete Power BI or Tableau dashboard with executive summary.

Course Format and Delivery
The course is delivered fully online through live, instructor-led sessions taught by working data analysts and BI practitioners from US organizations.
01
Schedule
Two live sessions per week over twelve weeks, in evening and weekend slots that work for working analysts across US time zones.
- Each session runs approximately 90 minutes.
02
Hands-On With Real Business Data
The course works with realistic business datasets throughout — customer, sales, marketing, financial, operational data.
- Real data. Real analytical patterns.
03
Recordings
Every session recorded and available within 24 hours.
- Access anytime, anywhere.
04
Cohort Discussion
Analysts from different industries comparing notes on how they apply the same techniques in different contexts.
- Peer learning across industries.
05
BI Tool Access
Free tiers of Power BI Desktop and Tableau Public are sufficient for the course.
- Free tool tiers. No purchases required.
Prerequisites And Technical Requirements
Built for analysts and analyst-track professionals. Prerequisites are modest:
Comfort with Excel or Google Sheets at the level of formulas and pivot tables
No prior programming required — Python and SQL taught from scratch
Basic math comfort (percentages, averages, general arithmetic)
Laptop with 8 GB RAM, modern OS, stable internet (Power BI is Windows-only)
Why Modern Analyst Skills Matter In The Us Job Market
The Analyst Market Has Bifurcated.
Analyst roles whose primary tools are still Excel and basic dashboarding have become more competitive with slower compensation growth. Analyst roles where the toolkit includes Python, SQL, AI-powered analysis, and modern BI have seen sustained demand and stronger compensation growth.
Visibility and Scope Expansion.
For most learners, the career impact is not a new role title but a step-change in capability within an existing role. Being the analyst who can write Python, build BI dashboards, and apply AI-augmented analysis translates directly to visibility, scope, and advancement opportunity.
Bridge to Data Science.
For learners who want to go further, this course is the natural bridge into the Mindvex Python for AI & Data Science and Machine Learning Bootcamp programs. Many analysts find that the modern-analyst toolkit is the right scope for their goals; those who want the data science depth have a clear path.
Learn From Industry Leaders
Michael Anderson
Lead Instructor — AI & Cloud
- AWS Certified
- 10+ Years Industry Experience
- Published AI Researcher
Senior AI engineer with extensive experience designing machine learning platforms and deploying enterprise AI solutions.
David Miller
Cloud & MLOps Instructor
- Cloud Architect
- Google Cloud Certified
- Enterprise MLOps Specialist
Cloud Architect specializing in scalable AI infrastructure, MLOps automation, and multi-cloud deployments for enterprise.
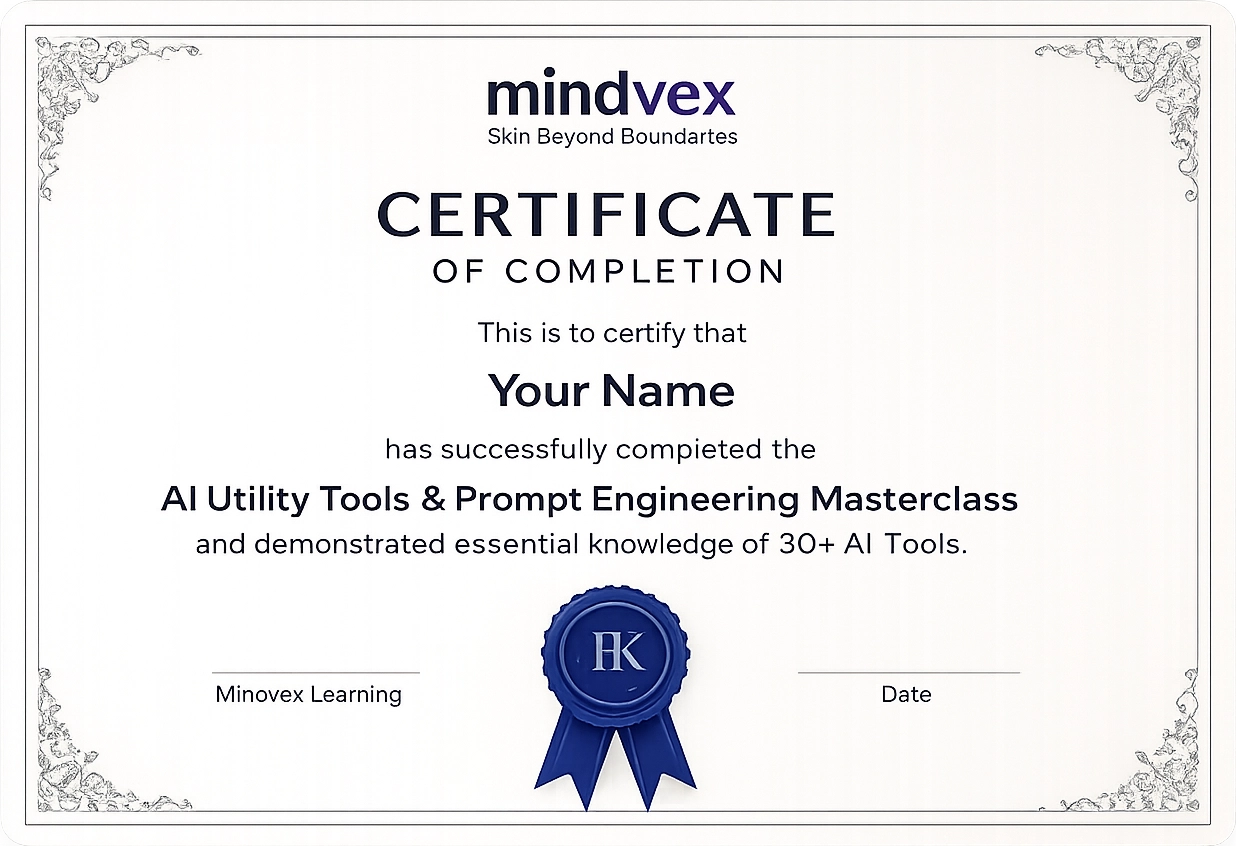
INDUSTRY RECOGNIZED CERTIFICATE
Receive an industry-recognized certificate after successful course completion.
- Industry Recognized
- LinkedIn Shareable
- Verifiable Certificate
- Career Boost
Career Impact
What Our Learners Say
The AI for Data Analytics course gave me the exact tools needed to interpret complex data streams quickly. The practical framework for integrating modern AI directly into existing analytical workflows was immediately applicable.

The multi-agent simulations in the Advanced Python for LLM & Multi Agent Systems course completely transformed our engineering team's approach to complex system design. Exceptional depth and real-world utility.

Enrolling our product team in Agentic AI & Multi Agent Autonomous Systems provided the strategic edge we were missing. The hands-on project structures made deploying autonomous agents far more straightforward.

After taking NLP with LLMs, I was able to fine-tune and deploy a custom retrieval-augmented model in weeks. The instructors cover production-grade deployment strategies that you rarely find in standard online courses.

The Executive Diploma in Deep AI & Cloud Intelligence offered a clear, high-level strategic overview without glossing over technical rigor. It helped our leadership team align our enterprise cloud architecture with modern AI solutions.

Bridging the gap between prototype models and production infrastructure can be tough, but MLOps & AI in Production laid out the best practices clearly. Highly recommended for any engineering group scaling AI services.

Ready To Upgrade Your Analyst Toolkit?
Join a cohort of analysts building the modern skill set.
Frequently Asked Questions
Yes. The course is specifically built for analysts moving into Python and SQL without prior coding experience. Analytical framing makes the material directly applicable, and the cohort typically includes many learners in exactly this profile.
Enough to do substantive analytical work, but not the depth data science roles require. For learners who want to go further, the recommended path is Python for AI & Data Science → Machine Learning Bootcamp.
Framing and pacing calibrated for analysts. Every technique taught in analytical context, datasets are realistic business data, and the curriculum includes AI-augmented analysis and BI platform integration specific to modern analyst work.
Both covered at the depth working analyst roles use. Balanced coverage because both are widely used in US organizations. Learners wanting certification depth in either platform should plan for additional independent study.
Yes. AI tools are integrated throughout rather than confined to a single module. The course covers what AI adds, where it fails, and the disciplined patterns that produce reliable output.
Yes. Two-sessions-per-week format with 4–6 hours independent practice is calibrated specifically for working analysts.
Yes. Cohort regularly includes professionals from non-analytical backgrounds. Career-change learners often combine this with additional study for a more complete entry into the analyst market.
Yes. Industry-agnostic core content. Datasets are drawn from across industries. Some of the strongest outcomes come from analysts in non-tech industries bringing modern capability into organizations where it has not been standard.
- Live Analyst-Paced Cohort
- Python + SQL + AI
- Power BI + Tableau
- Real Business Datasets